
Manual - Software, Perfusion Monitor
Back to Software
We no longer use Perfusion Software. This page is here for historical reference only.
This software controls the Perfusion hardware and also records all data to a text file.
See:
Click C:\CryoPerfusionMonitor\CryoPerfusionMonitor.exe or use a shortcut on the desktop
When the Startup window comes up, check the settings and click Start. This will immediately begin recording to the data file.
As long as the software is open, it will automatically plot on screen in the graphs as well as to a .csv text file. The text file is set to read-only during this time, but it may still be opened for viewing from the Setup window or directly through Windows.
Refresh Rates
Points on the right graphs are added 5.5 times per second. Temperature response is slightly slower, at once per second, resulting in a harmless stairstep appearance.
Points on the left graphs are added once per minute. This is a one-minute average rather than a snapshot. At the same time as the point is added on the left graph, the same value is added to the data file in real time. This never requires input from the user to ensure that it is always saving data. The fields saved to file are:
Date,TimeOfDay,DateTime,Temperatures(multiple columns),Pressure,PressureBackup,FlowTotal,FlowCarrier,FlowCPA,%CPA
Time of Pronouncement
You may set the time of pronouncement so that the Time Post Pronouncement (Time PP) will show at the top. Click the Change button.
Either leave both boxes blank or enter the pronouncement date and time, then click OK.
This will also allow the graphs to show Time PP rather than current time or time since daq was initiated. Time PP is not saved to the text file, because it might not be accurate, and because it can also be very easily derived from current time. Since all documentation should be recorded using current time, that number shows prominently at the top.
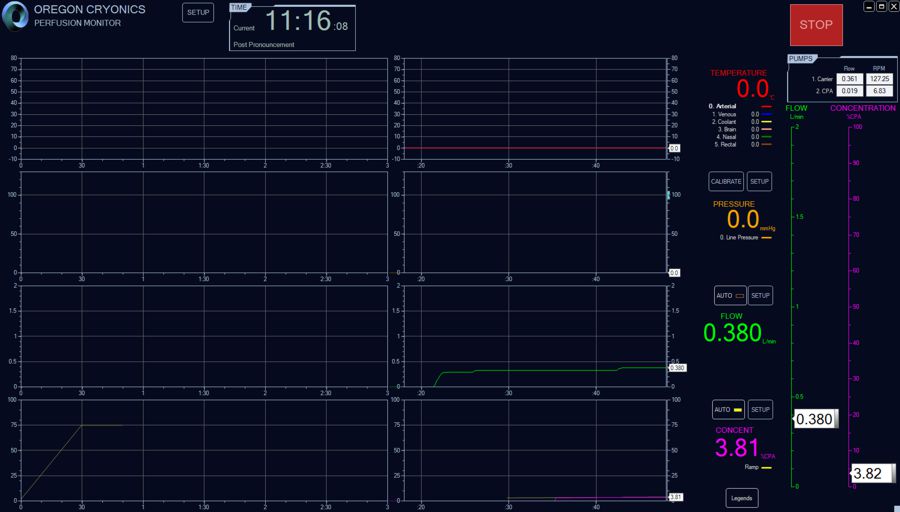
Plots and Bugs
Each graph can have multiple plotted lines. These plots are determined by the Config File. There is one primary plot, and for that plot, the white slider along the right will show the current value. In addition to the white slider, some graphs will have a blue bug.

Bugs are there to help you remember your target value. You may grab and move bugs. Hover over the bug to see the current value.

In some graphs, the bug serves the additional function of controlling automation. You set the bug, and then the automation manipulates parameters of the physical process to push the white indicator to the same value as the bug.
Pressure
The second graph is pressure. You can perform a calibration by clicking the Calibrate button.
Close the Calibrate Pressure window.
In the main window, the white slider shows the measured pressure from the primary Pressure Transducer and you cannot drag it. But you can drag and set the blue bug representing the target pressure. Set the bug to a target of 100 mmHg, for example. Manually control the flow in the third graph until the measured pressure is close to the target. Then turn on automation for flow as described below.
Flushing
1. Apply fluid pressure.
2. Squeeze flush valve.
3. If air later gets into the system, flush again with automation off.
Verification
After calibrating, Pressure Transducers have negligible drift with time, and recalibration should not be necessary during a case.
1. Compare with analog manometer, but error of 5 mmHg is expected due to mechanical limitations of the analog manometer.
2. Compare with second pressure transducer
3. Recalibrate only if necessary, after turning off automation.
Pumps
The circuit has two pumps that are shown at the upper right of the main window. The values in the boxes are read only.
Flow
The displayed flow on the graph is a combination of the Pump RPM and the Pump Shoe Size selection.
Check the box for Flow Automation. The automation attempts to stabilize the arterial line pressure based on the pressure bug.
Click Setup:

PID stands for Proportional-Integral-Derivative. It's a common algorithm used for automation control. Click PID:
The PID has a gentle Proportional (P) gain so that it will not bounce around too much. It has an aggressive Integral (I) gain so that it will quickly and smoothly seek new set points as needed. There is no Derivative (D) setting. If the pump and tubing are smaller, the values above may be too aggressive. You can turn them down using repeated trial and error. For example, try 1.0, then 0.3, etc. Choose numbers that will make your pump response more docile. Fine tune to get just the right amount of aggressiveness. These values can be changed on the fly while automation is on, and will take effect after clicking OK out of both windows. To save between sessions add and edit PumpGainP and PumpGainI rows to your Config File.
There are also a few separate hard-coded safety features:
1. If pressure reaches the top of the pressure graph, the pump will start quickly dropping speed, whether or not automation is turned on.
2. If pressure suddenly drops below 10mmHg because someone disconnected the pressure transducer, the automation will get turned off to prevent a sudden spin up of the pump.
Turning off Pump
Pumps may be switched off in a variety of ways. This may be necessary if the pump spins up accidentally. Turn off automation before turning the pump back on.
Cole Parmer:
1. Use the slider control in the software.
2. Software big red Stop button.
3. Switch on the back of the pump.
4. Int/Ext button on the front of the pump.
5. Pull the power cord out of the back of pump.
6. Open the pump shoe
Reglo:
1. Use the slider control in the software.
2. Software big red Stop button.
3. Open the pump shoe
* Do not use the power switch on the back or pull the power cord unless it's an emergency, because that will require restarting the software.
* Do not use the red stop button on the front because the pump will ignore it and start back up again.
Concentration
Concentration can be controlled manually or automatically. It affects the speed of the second CPA pump. Set a ramp, and then turn on automation.
Software Failure
If the software fails for some reason, there is an available manual control box with a knob for flow and a knob for concentration. It's wired like this:
Graph Legends
Click on the Legends button at the bottom right of the graphs
Maximum: Maximum Y value on the vertical axis.
Minimum: Minimum Y value.
Major Tick: The increment for the numbers and gridlines.
Minor Tick: The small unnumbered ticks between the major gridlines and numbers.
Show elapsed time rather than actual time of day: If this is checked, the X axis origin will be 0:00 rather than 9:54, for example. This will also need to be checked to show the elapsed Time Post Pronouncement (Time PP) along the X axis.
Autoscale instead of scroll: If this is checked, then the entire history will always show, and the scale will gradually become more compressed. The software will automatically reconfigure the major and minor ticks to keep the scale readable as it compresses.
Span (total time width): This does not apply when in autoscale mode.