Back to Software-Perfusion Monitor
This is an old archived page that is outdated. See the page above.
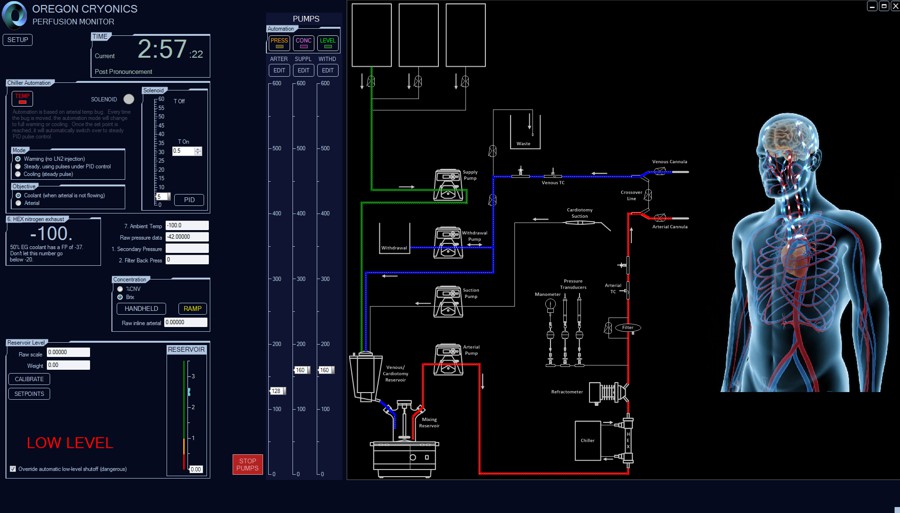
This software controls the Perfusion hardware and also records all data to a text file.
See Installation
Click C:\CryoPerfusionMonitor\CryoPerfusionMonitor.exe or use a shortcut on the desktop
When the Startup window comes up, check the settings and click Start. This will immediately begin recording to the data file.


As long as the software is open, it will automatically plot on screen in the graphs as well as to a .csv text file. The text file is set to read-only during this time, but it may still be opened for viewing from the Setup window or directly through Windows. It will add one row per minute to the file in real time, and never requires any input from user to ensure that it is saving data. The fields saved to file are:
Date,TimeOfDay,TArterial,TVenous,TCoolant,TBrain,TNasal,TRectal,Pressure,Flow,BrixArterial,BrixVenous,%CNV Arterial,%CNV Venous
Time of Pronouncement
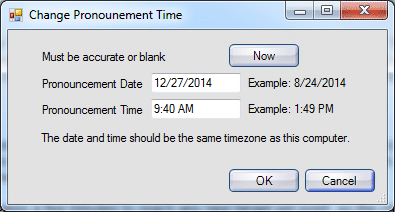
You may set the time of pronouncement so that the Time Post Pronouncement (Time PP) will show at the top. Click the Change button.

Either leave both boxes blank or enter the pronouncement date and time, then click OK.
This will also allow the graphs to show Time PP rather than current time or time since daq was initiated. Time PP is not saved to the text file, because it might not be accurate, and because it can also be very easily derived from current time. Since all documentation should be recorded using current time, that number shows prominently at the top.
Plots and Bugs
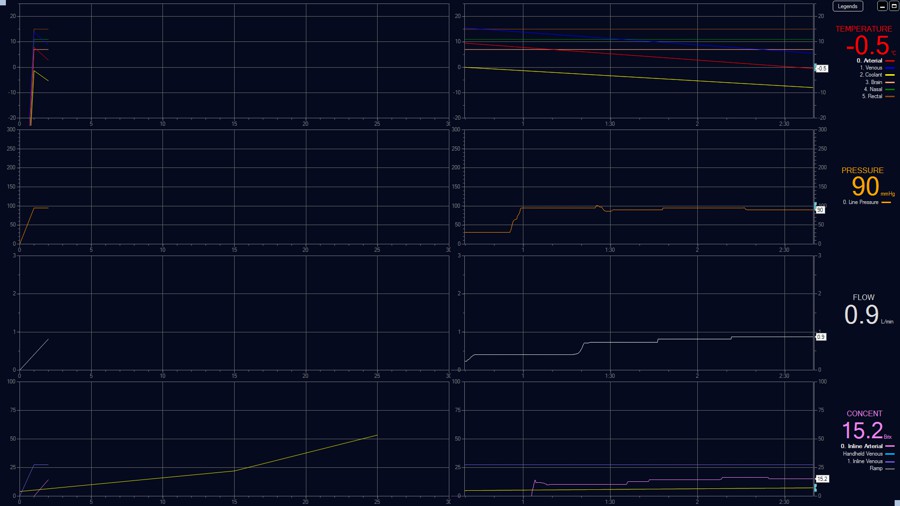
Each graph can have multiple plotted lines. These plots are designed ahead of time by the programmer, including color and hardware binding. There is one primary plot, and for that plot, the white slider along the right will show the current value. In addition to the white slider, some graphs will have a blue bug.

Bugs are there to help you remember your target value. You may grab and move bugs. Hover over the bug to see the current value.

In some graphs, the bug serves the additional function of controlling automation. You set the bug, and then the automation manipulates parameters of the physical process to push the white indicator to the same value as the bug.
Chiller Automation
This is only used with the Liquid Nitrogen Chiller, and the software functions are described on that page.
Main Pump Automation
Check the box for Pump Automation ON. The pump automation attempts to stabilize the arterial line pressure based on the pressure bug. The PID has a gentle Proportional gain so that it will not bounce around too much. It has an aggressive Integral gain so that it will quickly and smoothly seek new set points as needed. It will only take 5 seconds for the set point to go from 600 RPM down to zero, if needed.
A pump may be switched off at least 5 different ways:
1. Software big red Stop button.
2. Switch on back of pump.
3. Int/Ext button on front of pump.
4. Pull power cord out of the back of pump.
5. Open the pump shoe
Flow
The flow graph is derived from a combination of the Pump RPM slider and the Pump Shoe Size selection.
Concentration
See the Refractometer page.
Reservoir Level
See Reservoir Level page.
Graph Legends
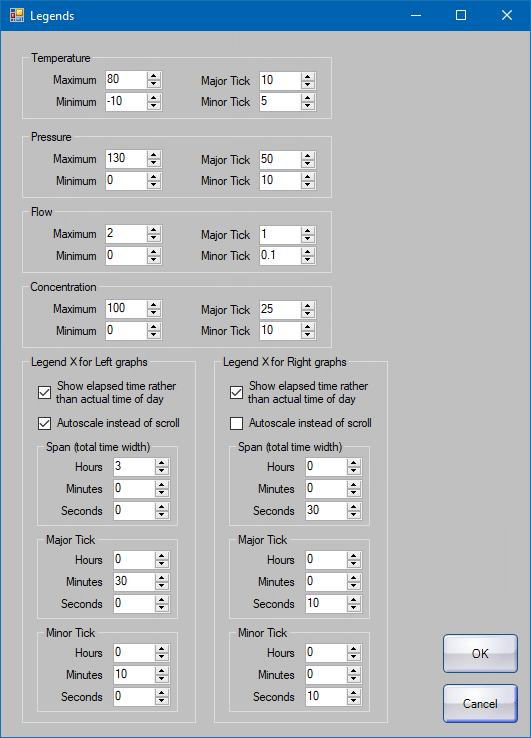
Click on the Legends button at the top right of the graphs

Maximum: Maximum Y value on the vertical axis.
Minimum: Minimum Y value.
Major Tick: The increment for the numbers and gridlines.
Minor Tick: The small unnumbered ticks between the numbers.
Show elapsed time rather than actual time of day: If this is checked, the X axis origin will be 0:00 rather than 9:54, for example. This will also need to be checked to show the elapsed Time Post Pronouncement (Time PP) along the X axis.
Autoscale instead of scroll: If this is checked, then the entire history will always show, and the scale will gradually become more compressed. The software will automatically reconfigure the major and minor ticks to keep the scale readable as it compresses.
Span (total time width): This does not apply when in autoscale mode.
